
The 7 Financial Choices You’ll Regret 5 Years From Now
If I could turn back time, here's a list of 7 decisions I would've made differently years ago.
Published July 25, 2023

![An Inside Look at Differences in Salary by Age [2023]](https://hubspot-test.credit.com/hs-fs/hubfs/Imported_Blog_Media/average-salary-by-age-hero-4.webp?width=842&height=474&name=average-salary-by-age-hero-4.webp)
Many or all of the products featured here are from our partners who compensate us. This may influence which products we write about and where and how the product appears on a page. However, this does not influence our evaluations.
With the job landscape constantly fluctuating, it’s not easy to grasp how your salary compares to your peers. However, workers can miss out on information impacting their financial journey if they don’t dig into salary data.
For instance, knowing the breakdown of American salaries by age can help people understand how their salaries can potentially progress. This data can also help inform how a person manages their finances in the long-term and other major decisions (like negotiating a salary raise).
Below, we look at salary by age in the U.S. and other breakdowns to help you see where you stand.
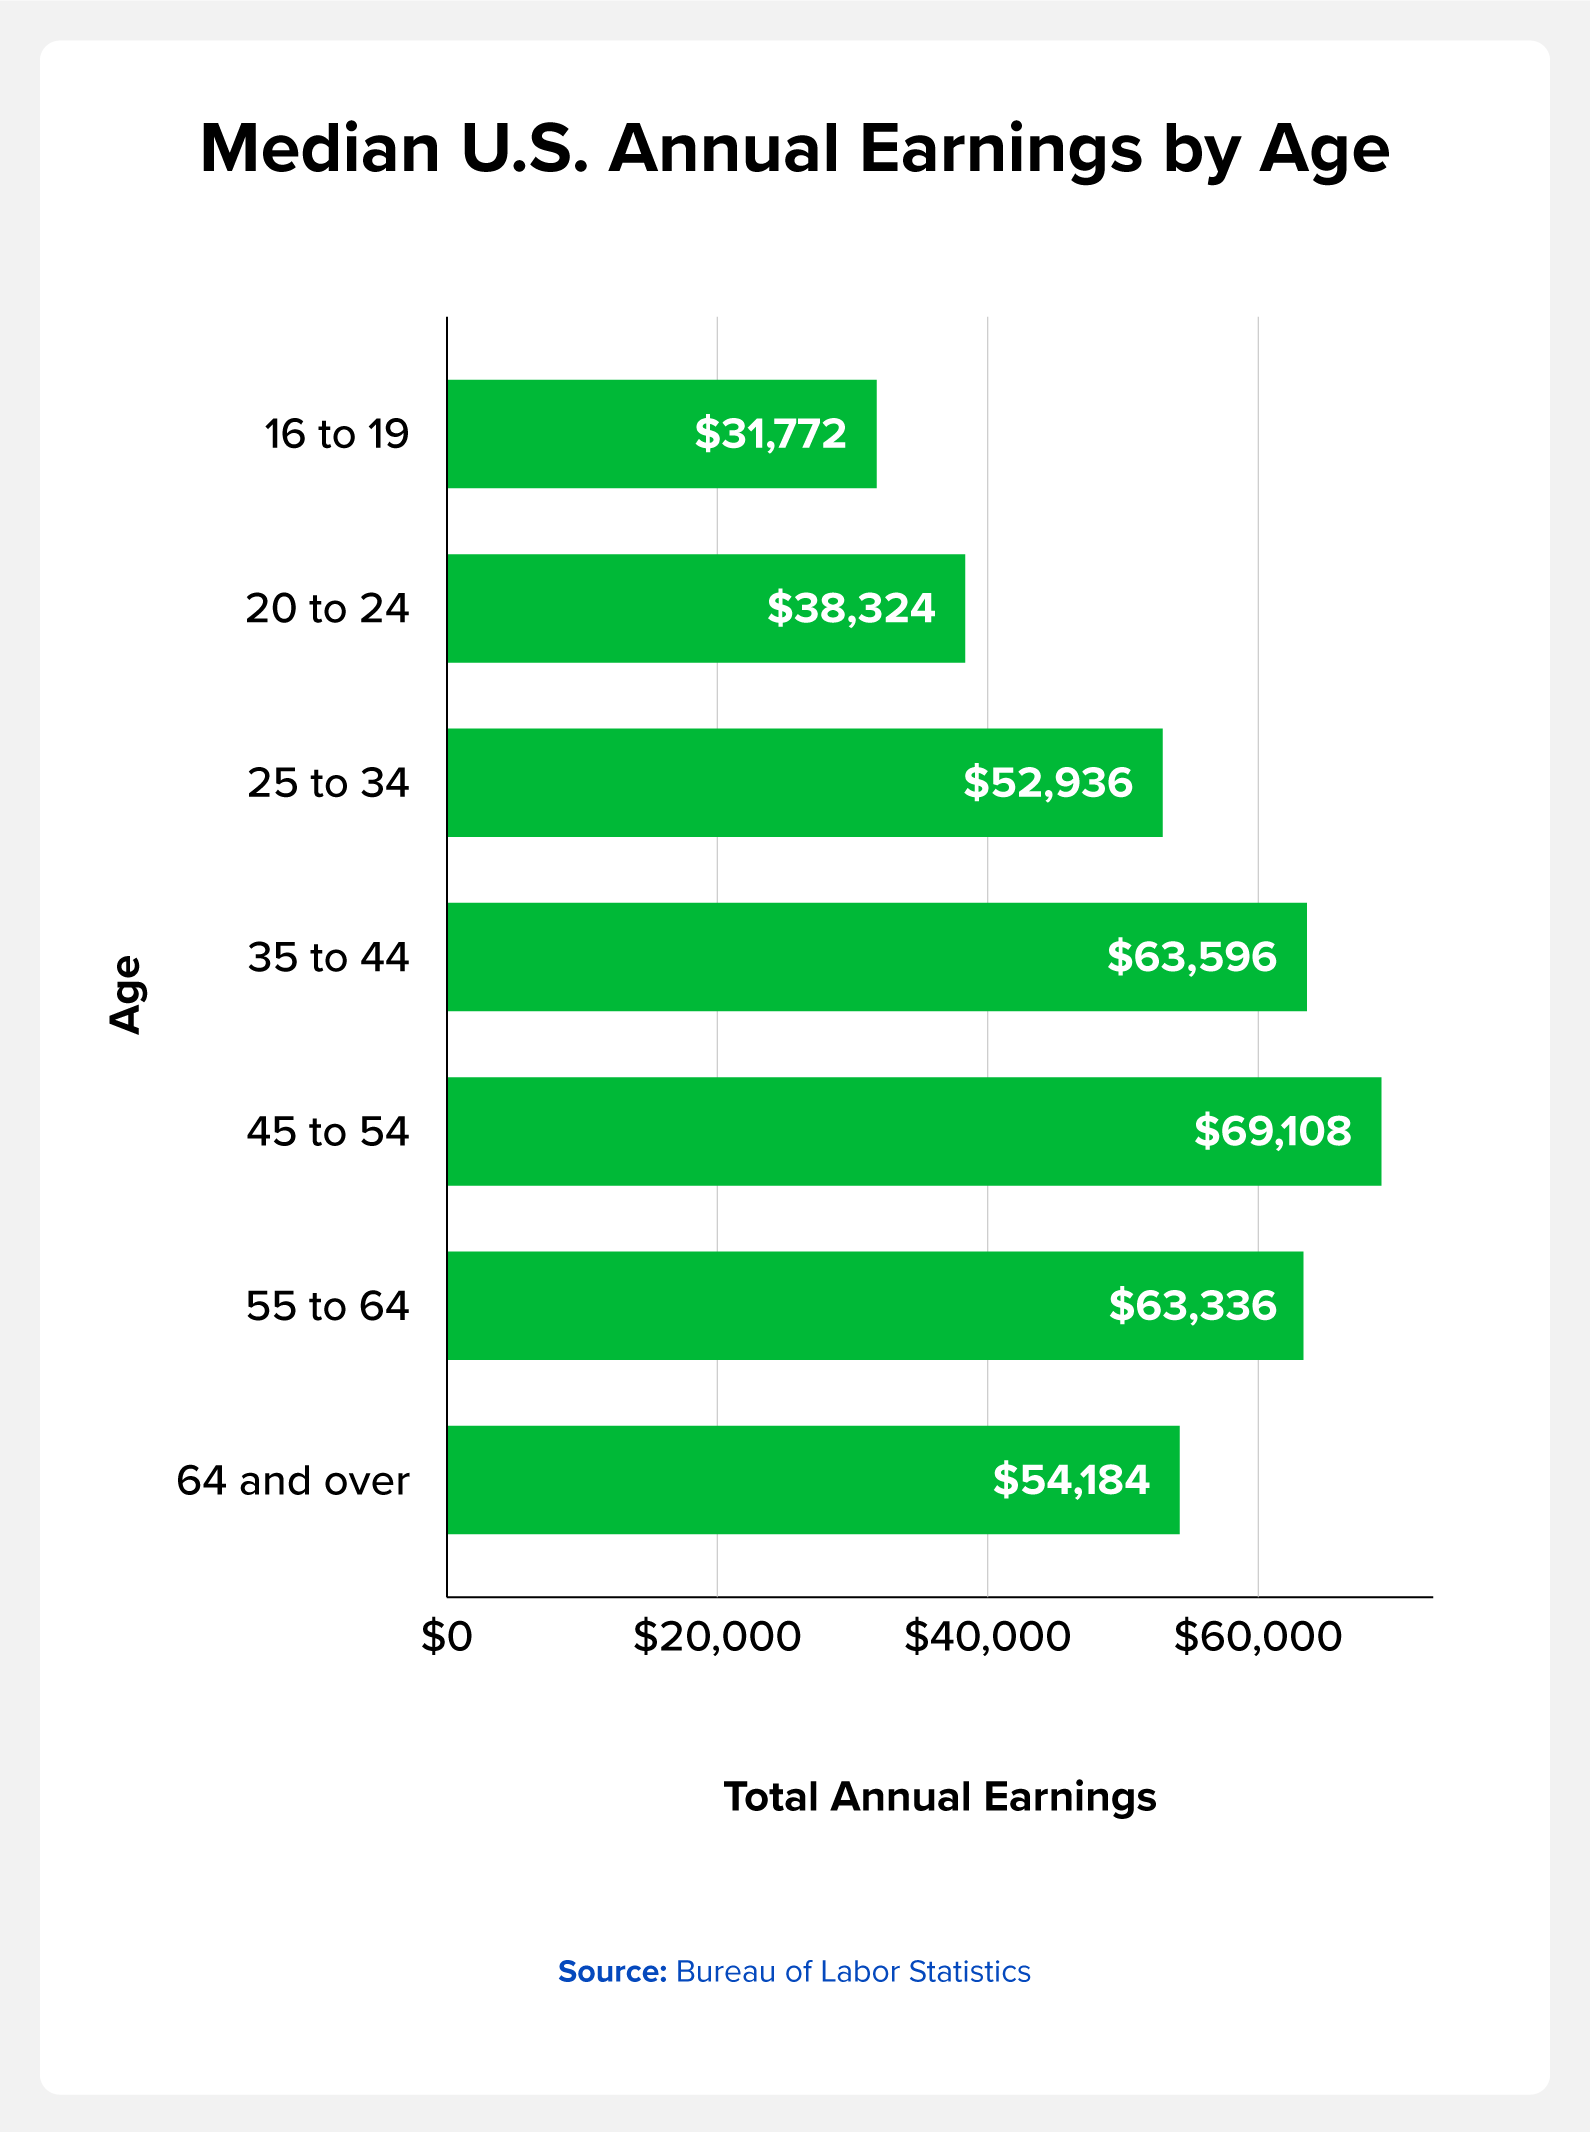
Earnings data from the Bureau of Labor Statistics (BLS) finds that workers generally make more as they get older.
Note that BLS uses measures like median wages instead of only averages to get more information, especially for a large range of data. For example, median weekly earnings can paint a more accurate picture than an average because it can’t get skewed by extremely high or low wages.
We take a look at differences in salary by age below by listing median weekly earnings and total annual salary (calculated by multiplying weekly earnings by 52 weeks).
| Age |
Median weekly earnings |
Total annual earnings
|
|---|---|---|
| 16 to 19 |
$611 |
$31,772 |
| 20 to 24 |
$737 |
$38,324 |
| 25 to 34 |
$1,018 |
$52,936 |
| 35 to 44 |
$1,223 |
$63,596 |
| 45 to 54 |
$1,239 |
$64,428 |
| 55 to 64 |
$1,218 |
$63,336 |
| 64 and over |
$1,042 |
$54,184 |
Other factors, like education level and gender, also impact a worker’s salary. We’ll go over these breakdowns below.
BLS data shows us the income gap between men and women increases with age.
Data from the Department of Labor also shows that the gender earnings ratio and wage gap impacts women differently across race and ethnicity. For example, Black women have a 7.3% wage gap compared to Black men, while Asian women have a 21.9% wage gap compared to Asian men.
There are many financial resources for women that provide guides and tips for managing finances. Legislators are also introducing fair pay legislation and local equal pay initiatives (like the California Equal Pay Pledge) to help close the gap.
The chart below shows that the gender wage gap starts immediately from the 16 to 19 range and gradually grows with each age gap.
| Age |
Men median weekly earnings |
Women median weekly earnings
|
Men total annual earnings
|
Women total annual earnings
|
|---|---|---|---|---|
| 16 to 19 |
$619 |
$598 |
$32,188 |
$31,096 |
| 20 to 24 |
$781 |
$702 |
$40,612 |
$36,504 |
| 25 to 34 |
$1,085 |
$970 |
$56,420 |
$50,440 |
| 35 to 44 |
$1,329 |
$1,112 |
$69,108 |
$57,824 |
| 45 to 54 |
$1,389 |
$1,098 |
$72,228 |
$57,096 |
| 55 to 64 |
$1,393 |
$1,044 |
$72,436 |
$54,288 |
| 64 and over |
$1,200 |
$926 |
$62,400 |
$48,152 |

Income by age can also vary based on education level. BLS data comparing earnings and education level shows us:
Earnings gradually trend up as workers increase their education level. Educational attainment data from the U.S. Census Bureau shows us that nearly 38% of Americans 25 and older earned a bachelor’s degree or higher in 2022. However, several factors can impact a person’s ability to access higher education, including affordability.
A study from the National Center for Education Statistics found that only 38% of students who thought their family could not afford to send them to college (“non-afforders”) were enrolled. Workers who want to advance their education can start familiarizing themselves with ways to fund education, like learning the differences between student loans and financial aid.
The chart below shows BLS data on how earnings differ between each education level.
| Education level |
Median weekly earnings |
Total annual earnings
|
|---|---|---|
| Less than a high school diploma |
$682 |
$35,464 |
| High school graduates (no college) |
$884 |
$45,968 |
| Some college or associate degree |
$995 |
$51,740 |
| Bachelor’s degree and higher |
$1,621 |
$84,292 |
Location can influence your salary and the cost of living in your area. BLS wage and state data show that:
However, higher wages don’t necessarily mean your dollar will go far. Understanding other factors, like the cost of living, can help understand how much your salary can support your living expenses.
The Bureau of Economic Analysis (BEA)’s regional price parity (RPP) data can give more context to the cost of living in each state. RPP measures the differences in price levels for a specific year. RPP values are represented as a percentage of the national price level (the U.S. = 100%).
For example, California has the third-highest wages and the second-highest RPP (nearly 112%). This means that California’s prices are higher than the national price level. In comparison, Mississippi offers the lowest wages but also has the lowest RPP (nearly 87%).
| State |
Average weekly wages |
Total annual wages
|
|---|---|---|
| Alabama |
$1,158 |
$60,216 |
| Alaska |
$1,299 |
$67,548 |
| Arizona |
$1,272 |
$66,144 |
| Arkansas |
$1,065 |
$55,380 |
| California |
$1,679 |
$87,308 |
| Colorado |
$1,472 |
$76,544 |
| Connecticut |
$1,593 |
$82,836 |
| Delaware |
$1,346 |
$69,992 |
| Florida |
$1,284 |
$66,768 |
| Georgia |
$1,289 |
$67,028 |
| Hawaii |
$1,227 |
$63,804 |
| Idaho |
$1,114 |
$57,928 |
| Illinois |
$1,432 |
$74,464 |
| Indiana |
$1,131 |
$58,812 |
| Iowa |
$1,153 |
$59,956 |
| Kansas |
$1,125 |
$58,500 |
| Kentucky |
$1,099 |
$57,148 |
| Louisiana |
$1,134 |
$58,968 |
| Maine |
$1,165 |
$60,580 |
| Maryland |
$1,462 |
$76,024 |
| Massachusetts |
$1,790 |
$93,080 |
| Michigan |
$1,274 |
$66,248 |
| Minnesota |
$1,357 |
$70,564 |
| Mississippi |
$947 |
$49,244 |
| Missouri |
$1,172 |
$60,944 |
| Montana |
$1,118 |
$58,136 |
| Nebraska |
$1,154 |
$60,008 |
| Nevada |
$1,244 |
$64,688 |
| New Hampshire |
$1,484 |
$77,168 |
| New Jersey |
$1,534 |
$79,768 |
| New Mexico |
$1,115 |
$57,980 |
| New York |
$1,736 |
$90,272 |
| North Carolina |
$1,235 |
$64,220 |
| North Dakota |
$1,204 |
$62,608 |
| Ohio |
$1,203 |
$62,556 |
| Oklahoma |
$1,073 |
$55,796 |
| Oregon |
$1,302 |
$67,704 |
| Pennsylvania |
$1,320 |
$68,640 |
| Puerto Rico |
$665 |
$34,580 |
| Rhode Island |
$1,261 |
$65,572 |
| South Carolina |
$1,111 |
$57,772 |
| South Dakota |
$1,096 |
$56,992 |
| Tennessee |
$1,254 |
$65,208 |
| Texas |
$1,372 |
$71,344 |
| Utah |
$1,230 |
$63,960 |
| Vermont |
$1,207 |
$62,764 |
| Virgin Islands |
$1,021 |
$53,092 |
| Virginia |
$1,416 |
$73,632 |
| Washington |
$1,631 |
$84,812 |
| West Virginia |
$1,067 |
$55,484 |
| Wisconsin |
$1,188 |
$61,776 |
| Wyoming |
$1,137 |
$59,124 |
Having a grasp of where you stand can help you make more informed decisions to achieve your financial goals. Whether it’s to save up to buy a house or to build up your savings, understanding your salary’s potential growth is one of many ways to prepare for the future you want.
It’s also a signal of whether it’s time to negotiate a new salary, especially since most U.S. workers don’t ask for higher pay (when starting a new job). Or, it may be time to start a new role since 60% of workers who switched jobs saw their earnings increase compared to the previous year.

If you want a broader look at your financial standing beyond your income, consider checking out your credit score for free today.

If I could turn back time, here's a list of 7 decisions I would've made differently years ago.

There are many ways to avoid financial stress and consistently have spendable wealth. Here are 6 tips to become independently wealthy.
There are many ways to avoid financial stress and consistently have spendable wealth. Here are 6 tips to become independently wealthy.